I have been experiencing that annoying Safe Mode crash dump popup every time I restart Cubase. For the record, at the time of writing I’m using Cubase 12.0.60 build 453 on Windows 11 (technically Version 10.0.22621 Build 22621).
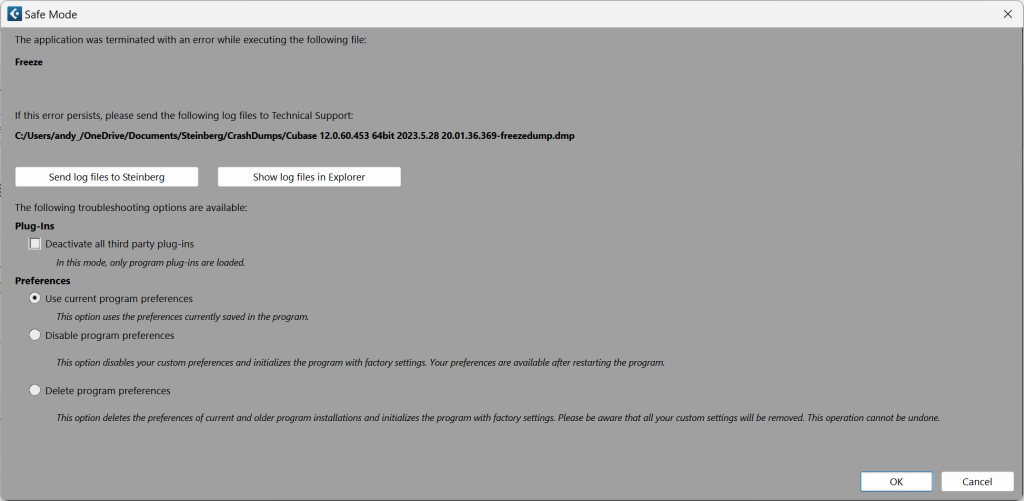
I’ve dutifully clicked the button in the Cubase popup to send the crash dump files to Steinberg but that doesn’t really help stop the problem. So, how can we get some information out of the crash dump file?
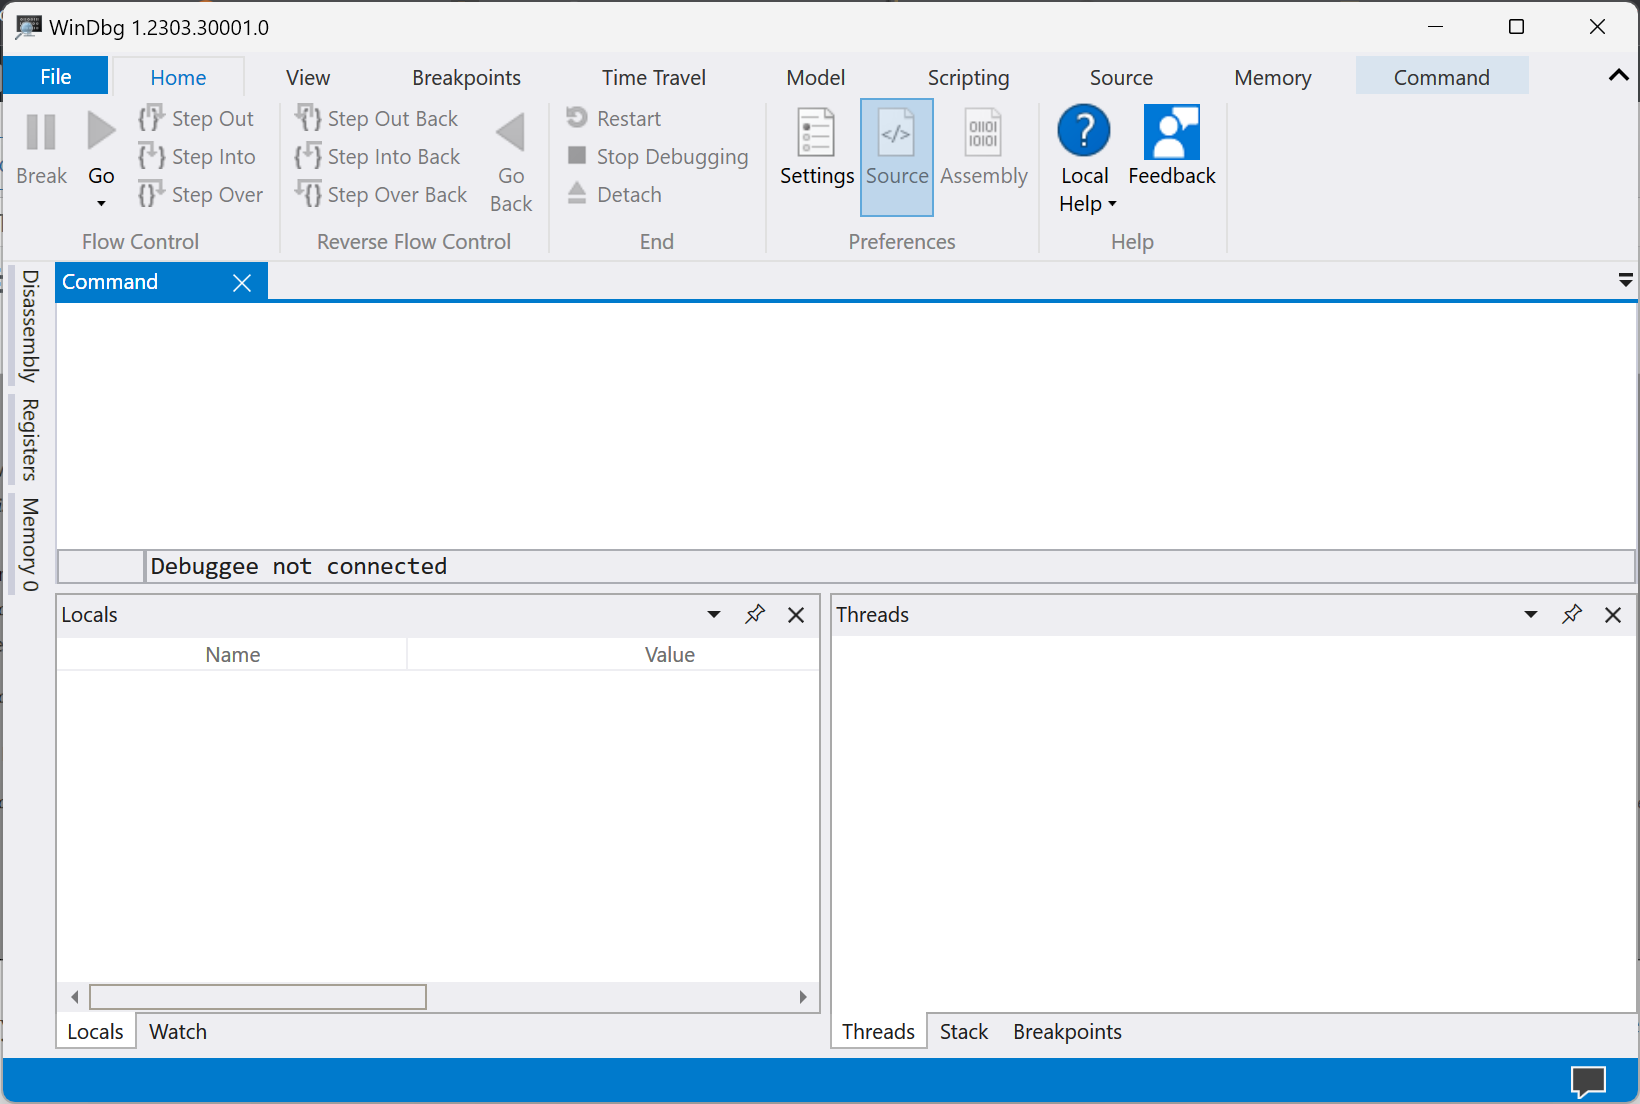
Basically, you need to use a specialist tool that’s usually used by software developers. There are different options but the easiest is to use WinDbg which is distributed by Microsoft. I’ve tried using JetBrains dotMemory but these crash dump files are not compatible, being “mini” dump files. WinDbg is a free tool and can be found here.
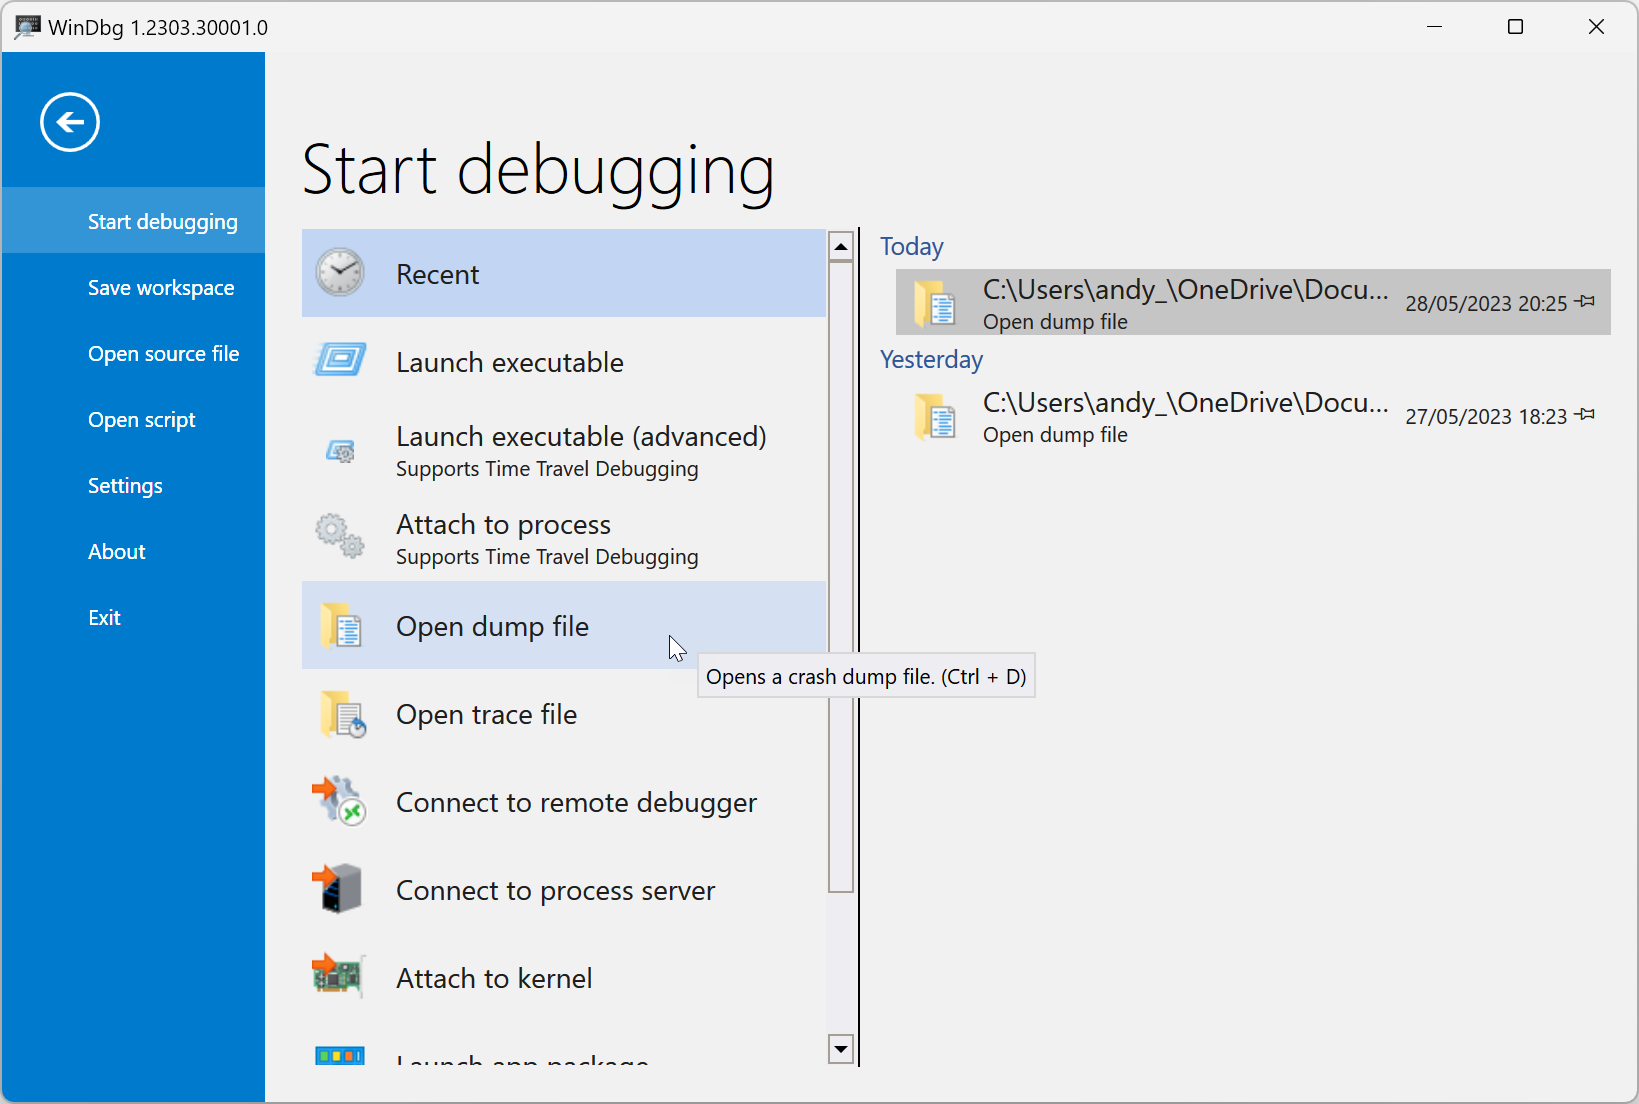
Once downloaded and installed all you need to do is open it and go to File > Open Dump File.
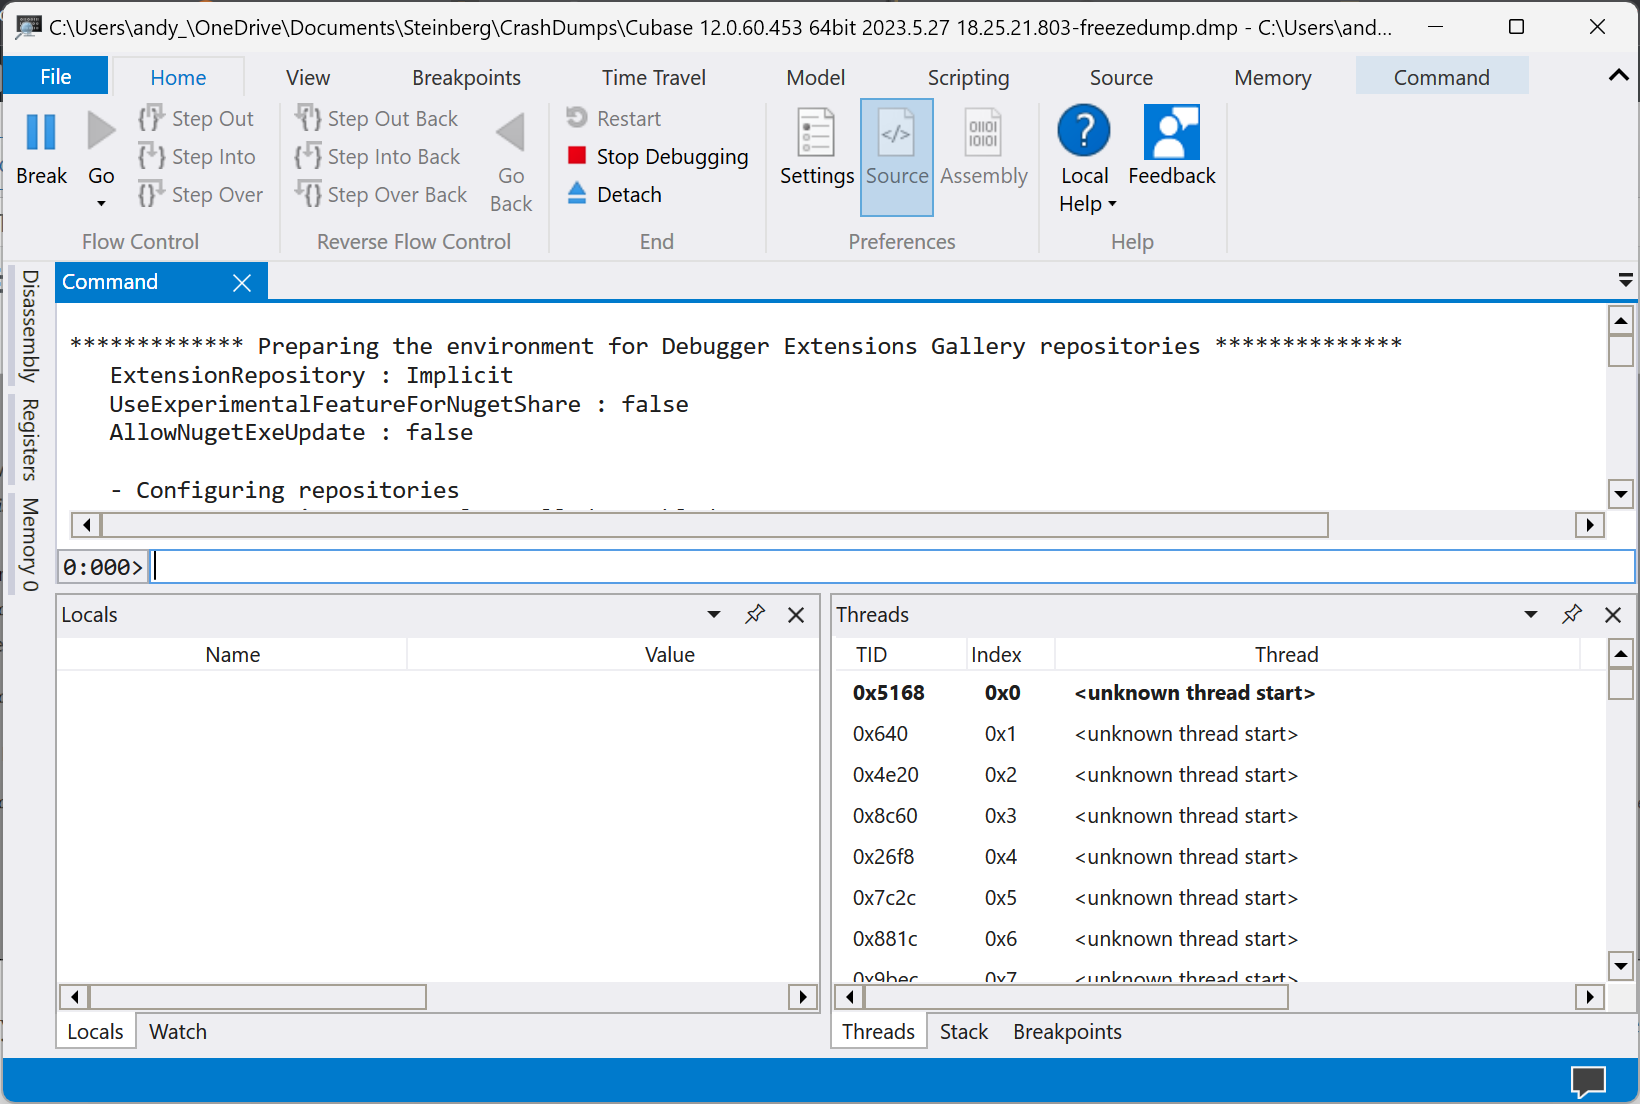
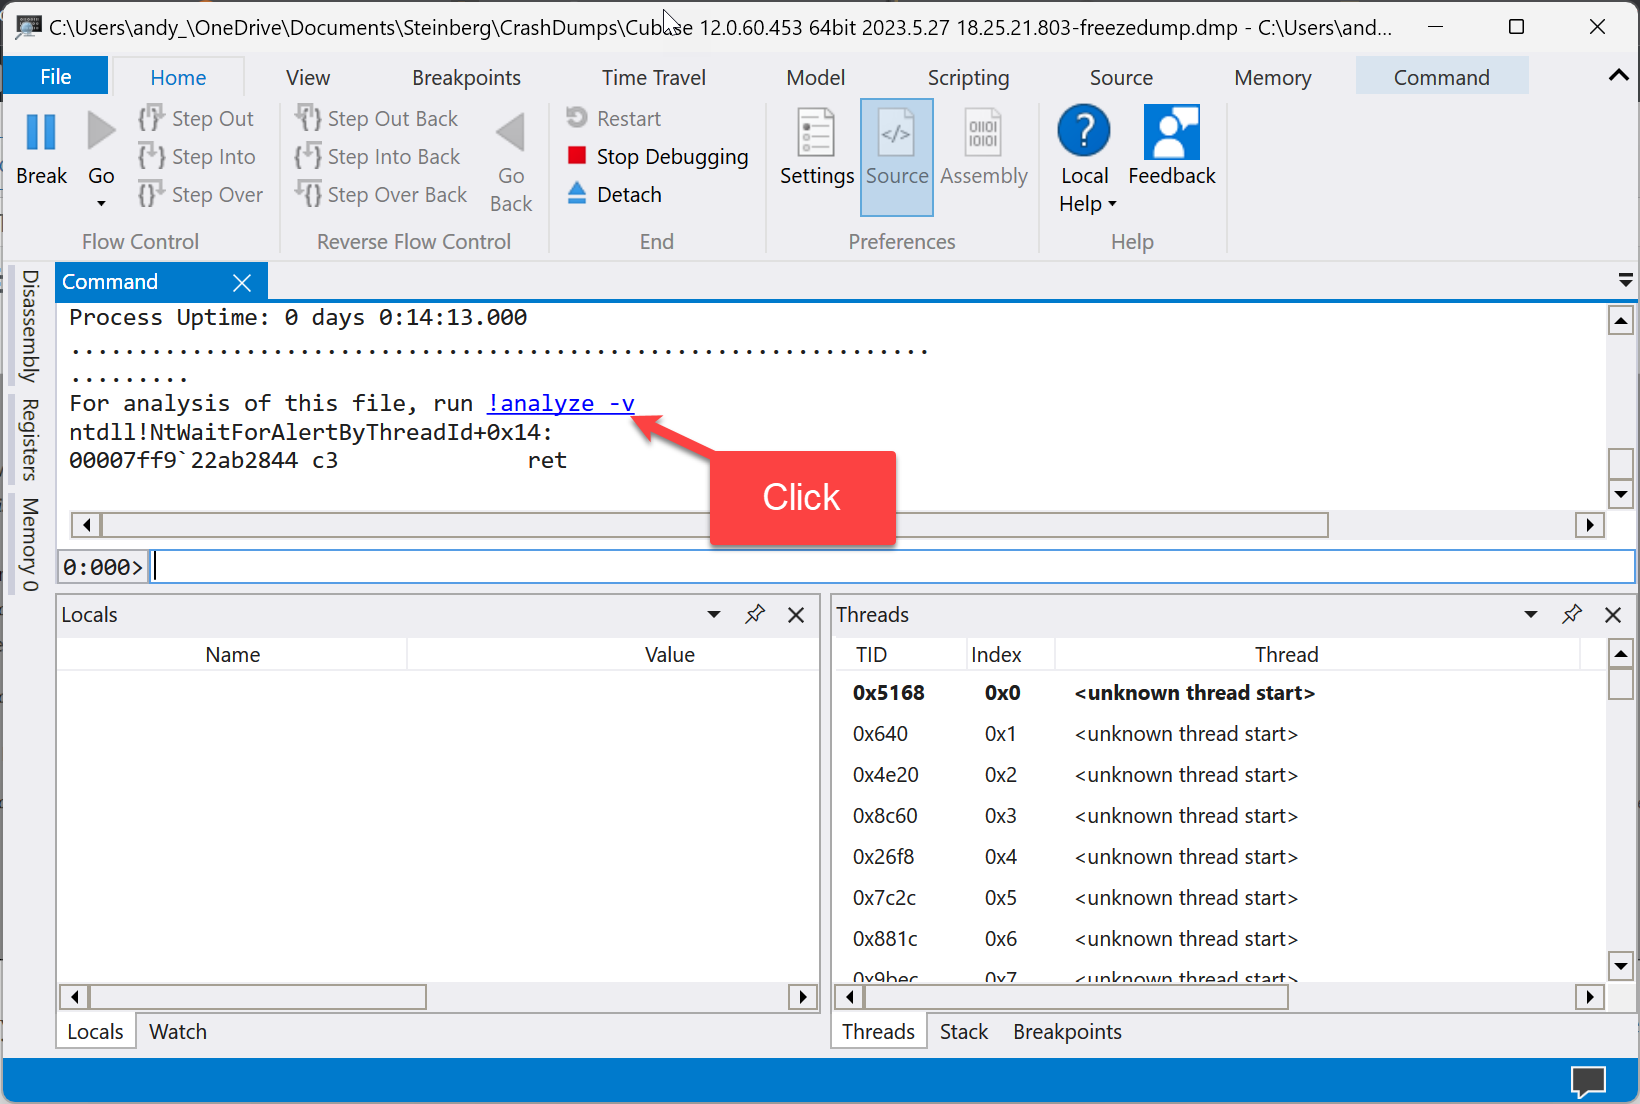
Once opened you’ll see some summary information about the crash dump displayed in the Command window. If you scroll down you’ll see some text saying “For analysis of this file, run !analyze -v”. The easiest way to proceed is to click on the link “!analyze -v” and wait for the analysis to complete.
With any luck you’ll get some nice information about what went wrong. You may need to scroll to the bottom of the output and in my case I could see it was the Torpedo Wall of Sound plugin that’s the cause of the issue.
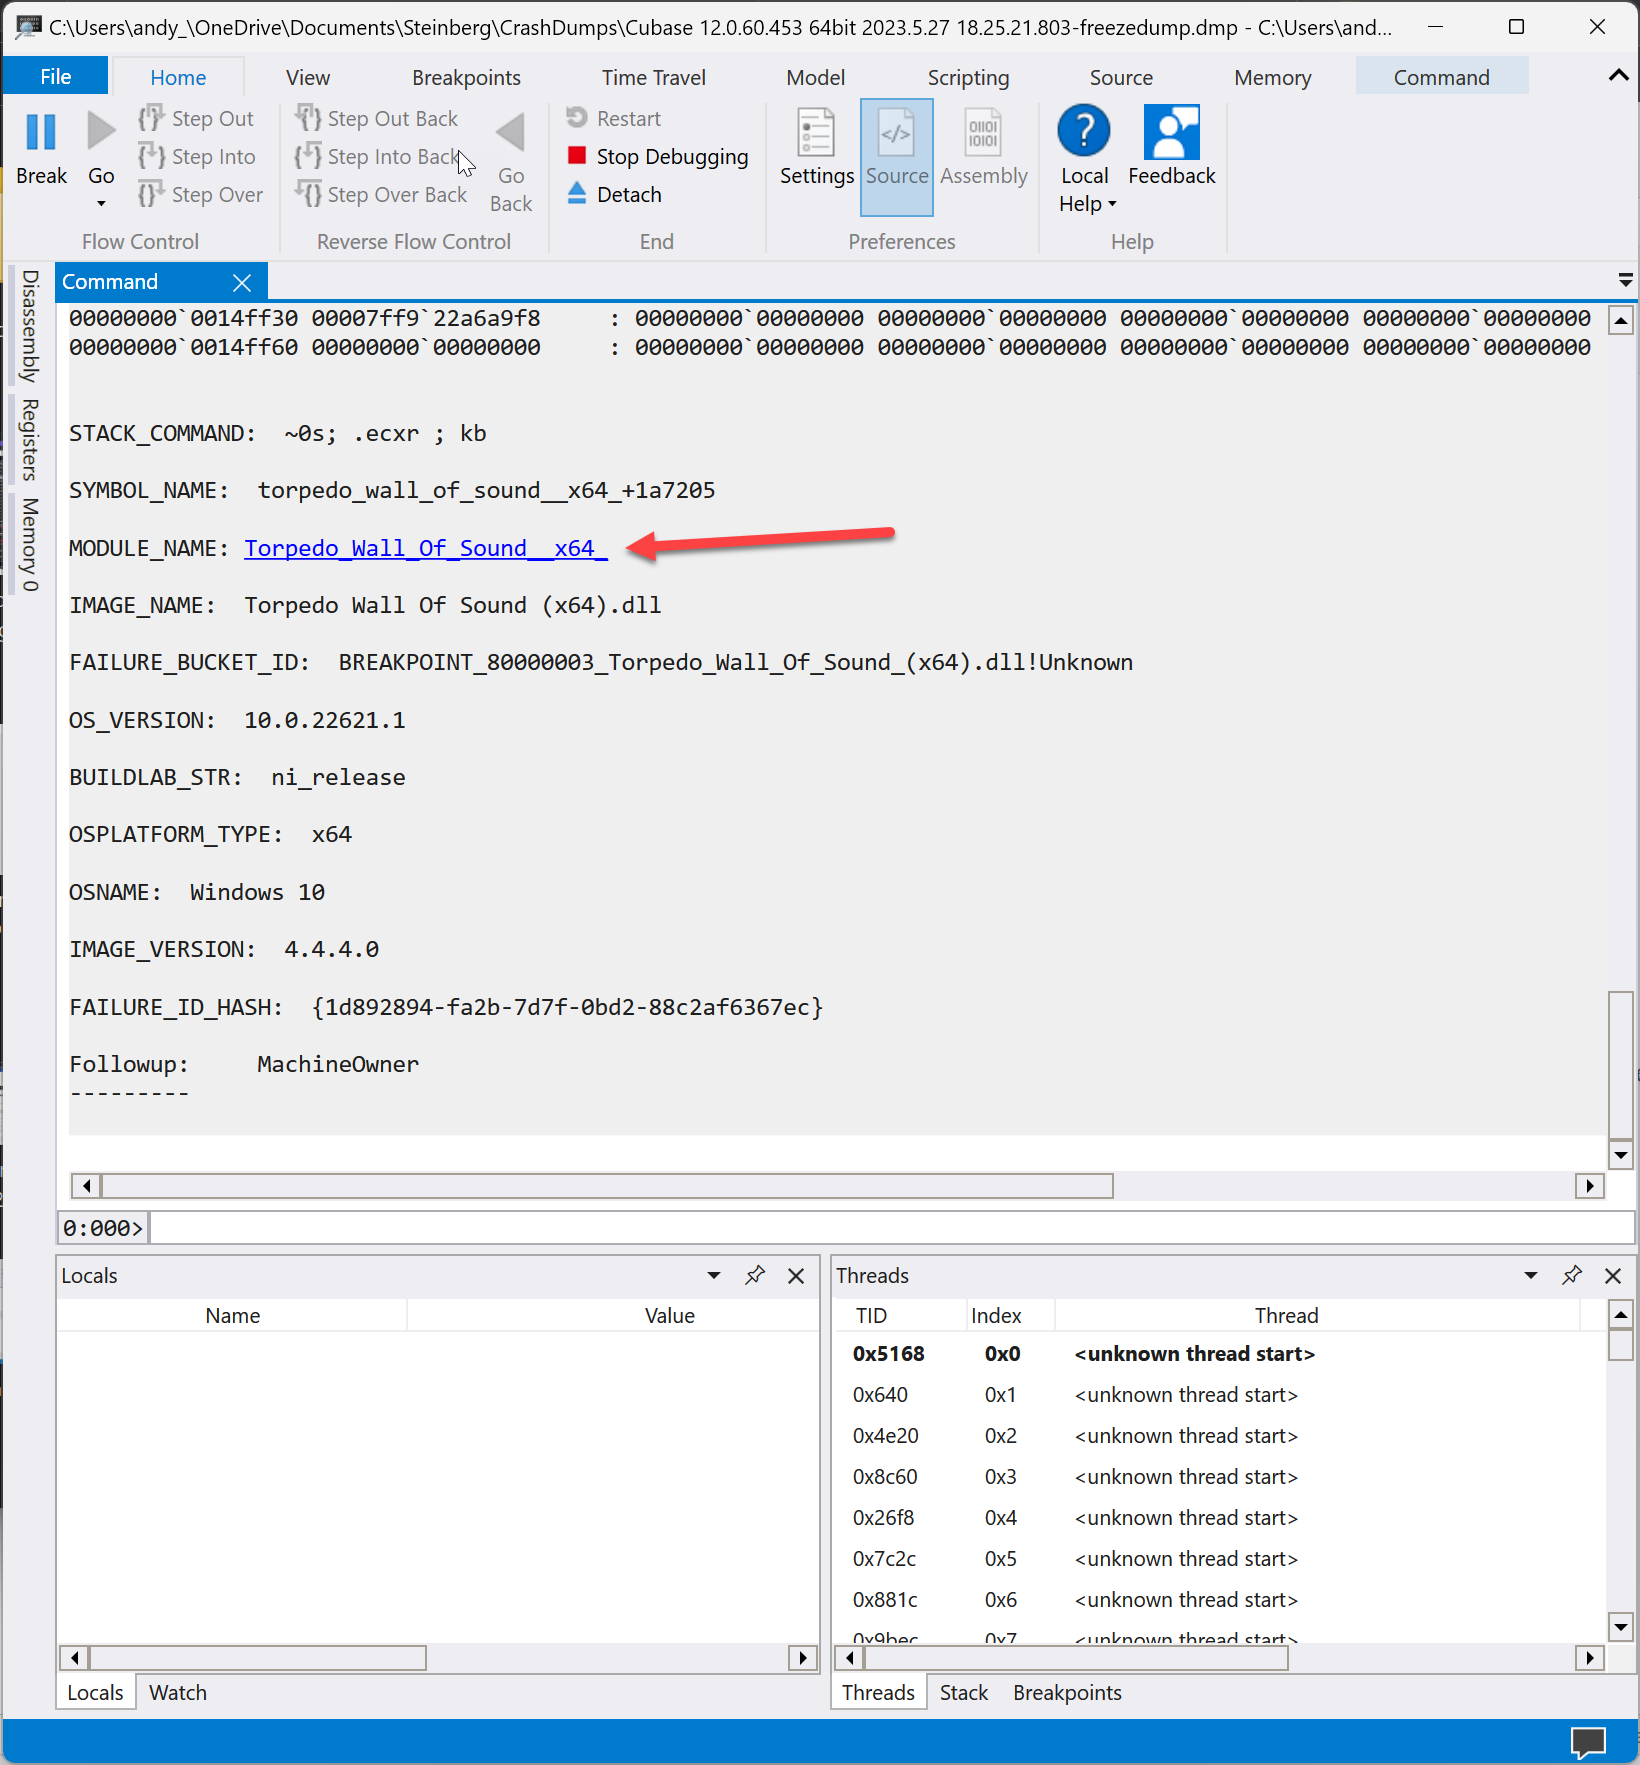
Options to consider: installing an update to the plugin (if available), removing the plugin if not in use, or reporting the issue to the plugin developer.